Updated statistics about the most used social media in the world (only based on official information).
| Social Media | Registered Users | Monthly Active Users | Daily Active Users | Source |
| n.a. | 3.070.000.000 | 2.110.000.000 | ||
| YouTube | n.a. | 2.000.000.000 | n.a. | YouTube |
| n.a. | 2.000.000.000 | n.a. | CNBC | |
| TikTok | n.a. | 1.000.000.000 | n.a. | TikTok |
| Douyin | n.a. | 600.000.000 | n.a. | China Daily |
| QZone | n.a. | 571.100.000 | n.a. | Tencent |
| n.a. | 537.000.000 | n.a. | ||
| n.a. | 431.000.000 | 190.000.000 | ||
| Snapchat | n.a. | 850.000.000 | 432.000.000 | Snapchat |
| n.a. | 570.000.000 | n.a. | ||
| Threads | n.a. | 200.000.000 | n.a. | Threads |
| n.a. | n.a. | 52.000.000 | ||
| 875.000.000 | 350.000.000* | n.a. | ||
| Quora | 300.000.000 | n.a. | Quora | |
| VK | n.a. | 97.000.000 | n.a. | VK |
| Twitch | n.a. | n.a. | 30.000.000 | Twitch |
| Odnoklassniki | n.a. | 71.000.000 | n.a. | OK |
If you want to see the geographic distribution visit The World Map of Social Networks.
Updated statistics about the most used Instant Messaging Apps in the world (only based on official information).
| App | Registered Users | Monthly Active Users | Daily Active Users | Source |
| n.a. | 2.500.000.000* | 2.000.000.000 | ||
| Facebook Messenger | n.a. | 1.300.000.000 | n.a. | |
| n.a. | 1.262.000.000 | n.a. | Tencent | |
| n.a. | 606.000.000 | n.a. | Tencent | |
| Telegram | n.a. | 950.000.000 | n.a. | Telegram |
| Skype | n.a. | 300.000.000 | n.a. | MSPowerUser |
| Viber | 608.000.000 | 260.000.000 | n.a. | Pymnts |
| Line | n.a. | 86.000.000 | n.a. | Japan Times |
| Discord | n.a. | 140.000.000 | n.a. | Techcrunch |
_____________
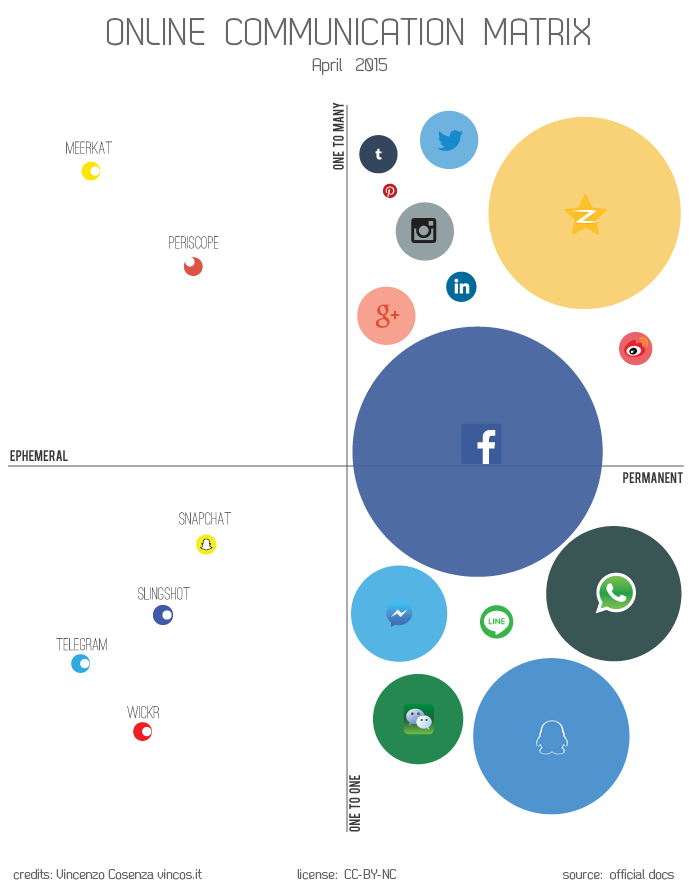
To summarize the current state of online communication I’ve create a matrix with 3 dimensions: the type of communication (from one to many to one to one), the nature of the messages (ephemeral vs permanent), the size of each community (in terms of monthly active users).
___________________________________________
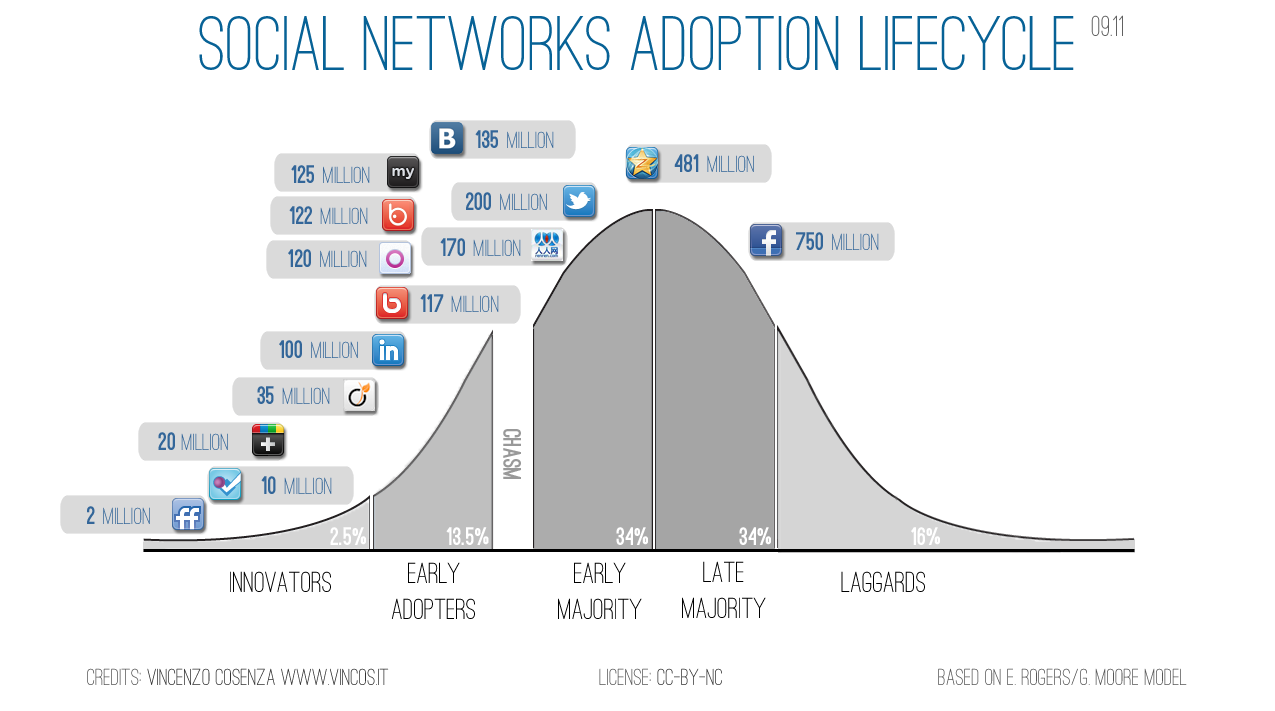
The Diffusion of technologies (2011)
The diffusion of new technologies follows a classic normal distribution or “bell curve” and, according to Everett Rogers’ studies (Diffusion of Innovation, 1962), anyone who engages with a given innovation fits into one of five categories: innovators (2.5% of the potential population of adopters), early adopters (12.5%), early majority (34%), late majority (34%), laggards (16%). Each of these groups has unique psychographic characteristics that cause people to be more or less likely to adopt a given technology at a particular point in time. To understand the model you need to focus on the area under the curve that represents the percentage of adoption within each group.
The rate of adoption is defined as the relative speed with which members of a social system adopt an innovation. It is usually measured by the length of time required for a certain percentage of the members of a social system to adopt an innovation.
Later Geoffrey Moore (Crossing the Chasm, 1991) proposed a variation on Rogers’ model. He suggested that for discontinuous or disruptive innovations, there is a gap or chasm to cross between the first two adopter groups (innovators + early adopters) and the early majority.
I’ve tried to apply this model to the diffusion of social networking sites (SNS) with the aim of plotting their actual state and, hopefully, understanding their future trajectories. To determine the rate of diffusion of each social network I’ve divided the number of registered users by the number of potential adopters (1 billion in my assumption).
To put this infographic on your web site, just copy and paste the HTML code below:
In the innovators area we can place Friendfeed, which unfortunately stopped innovating after its acquisition by Facebook; Foursquare, the most famous location based social network with 10 million users; and Google+ with its explosive adoption rate (20 million users in 3 weeks).
In the early adoption stage we find professional social networks like Viadeo and LinkedIn, or generalist ones like Orkut (owned by Google), VKontakte (leader in Russian territories), Bebo. Badoo is the only service specifically designed for dating purposes. MySpace, after reaching the early majority is now struggling for conquering a niche (it fell from 225 million users to 125 million because of several management mistakes and Facebook’s rise).
RenRen, the most important Chinese real-name SNS, and Twitter were able to successfully cross the chasm and reach the early majority. Meanwhile QZone, China’s largest nickname network built on the back of Tencent’s QQ Messenger, is entering the late majority area.
Lastly, Facebook the social network that has conquered the masses seems determined to hit the one billion users mark.
From now on I will try to collect social media statistics in order to periodically update the adoption lifecycle model. Please share and help me to improve my research.